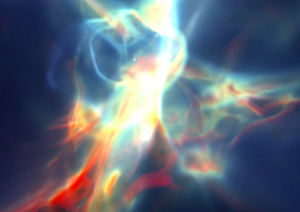
Most astronomical observations are conducted through the detection of electromagnetic waves from distant objects. To make a direct link between simulations and observations, it is beneficial to construct photo-realistic visualizations of the data. This relates to the topic of radiation transport through the computation of the emission and absorption features in astronomical objects. Example diagnostic images and spectra consider (1) blackbody emission, (2) line emission from the ultraviolet Lyman alpha transition, Balmer alpha and O III in the visual, and [C I] and CO in the sub-millimeter, (3) Rayleigh scattering, and (4) absorption lines from various transitions. Using a physical basis for visualization gives researchers a common ground for comparing data. Lastly, the universe is beautiful, and we strive to visualize our data as realistically as possible. Most importantly, these visualizations can captivate the public’s mind by presenting the science in a visual and intuitive manner.